LiteLLM observability
Monitor every LiteLLM request across 100+ providers in PromptLayer. Full cost, latency, and token analytics with OpenTelemetry — one config line.
Trace every LiteLLM run
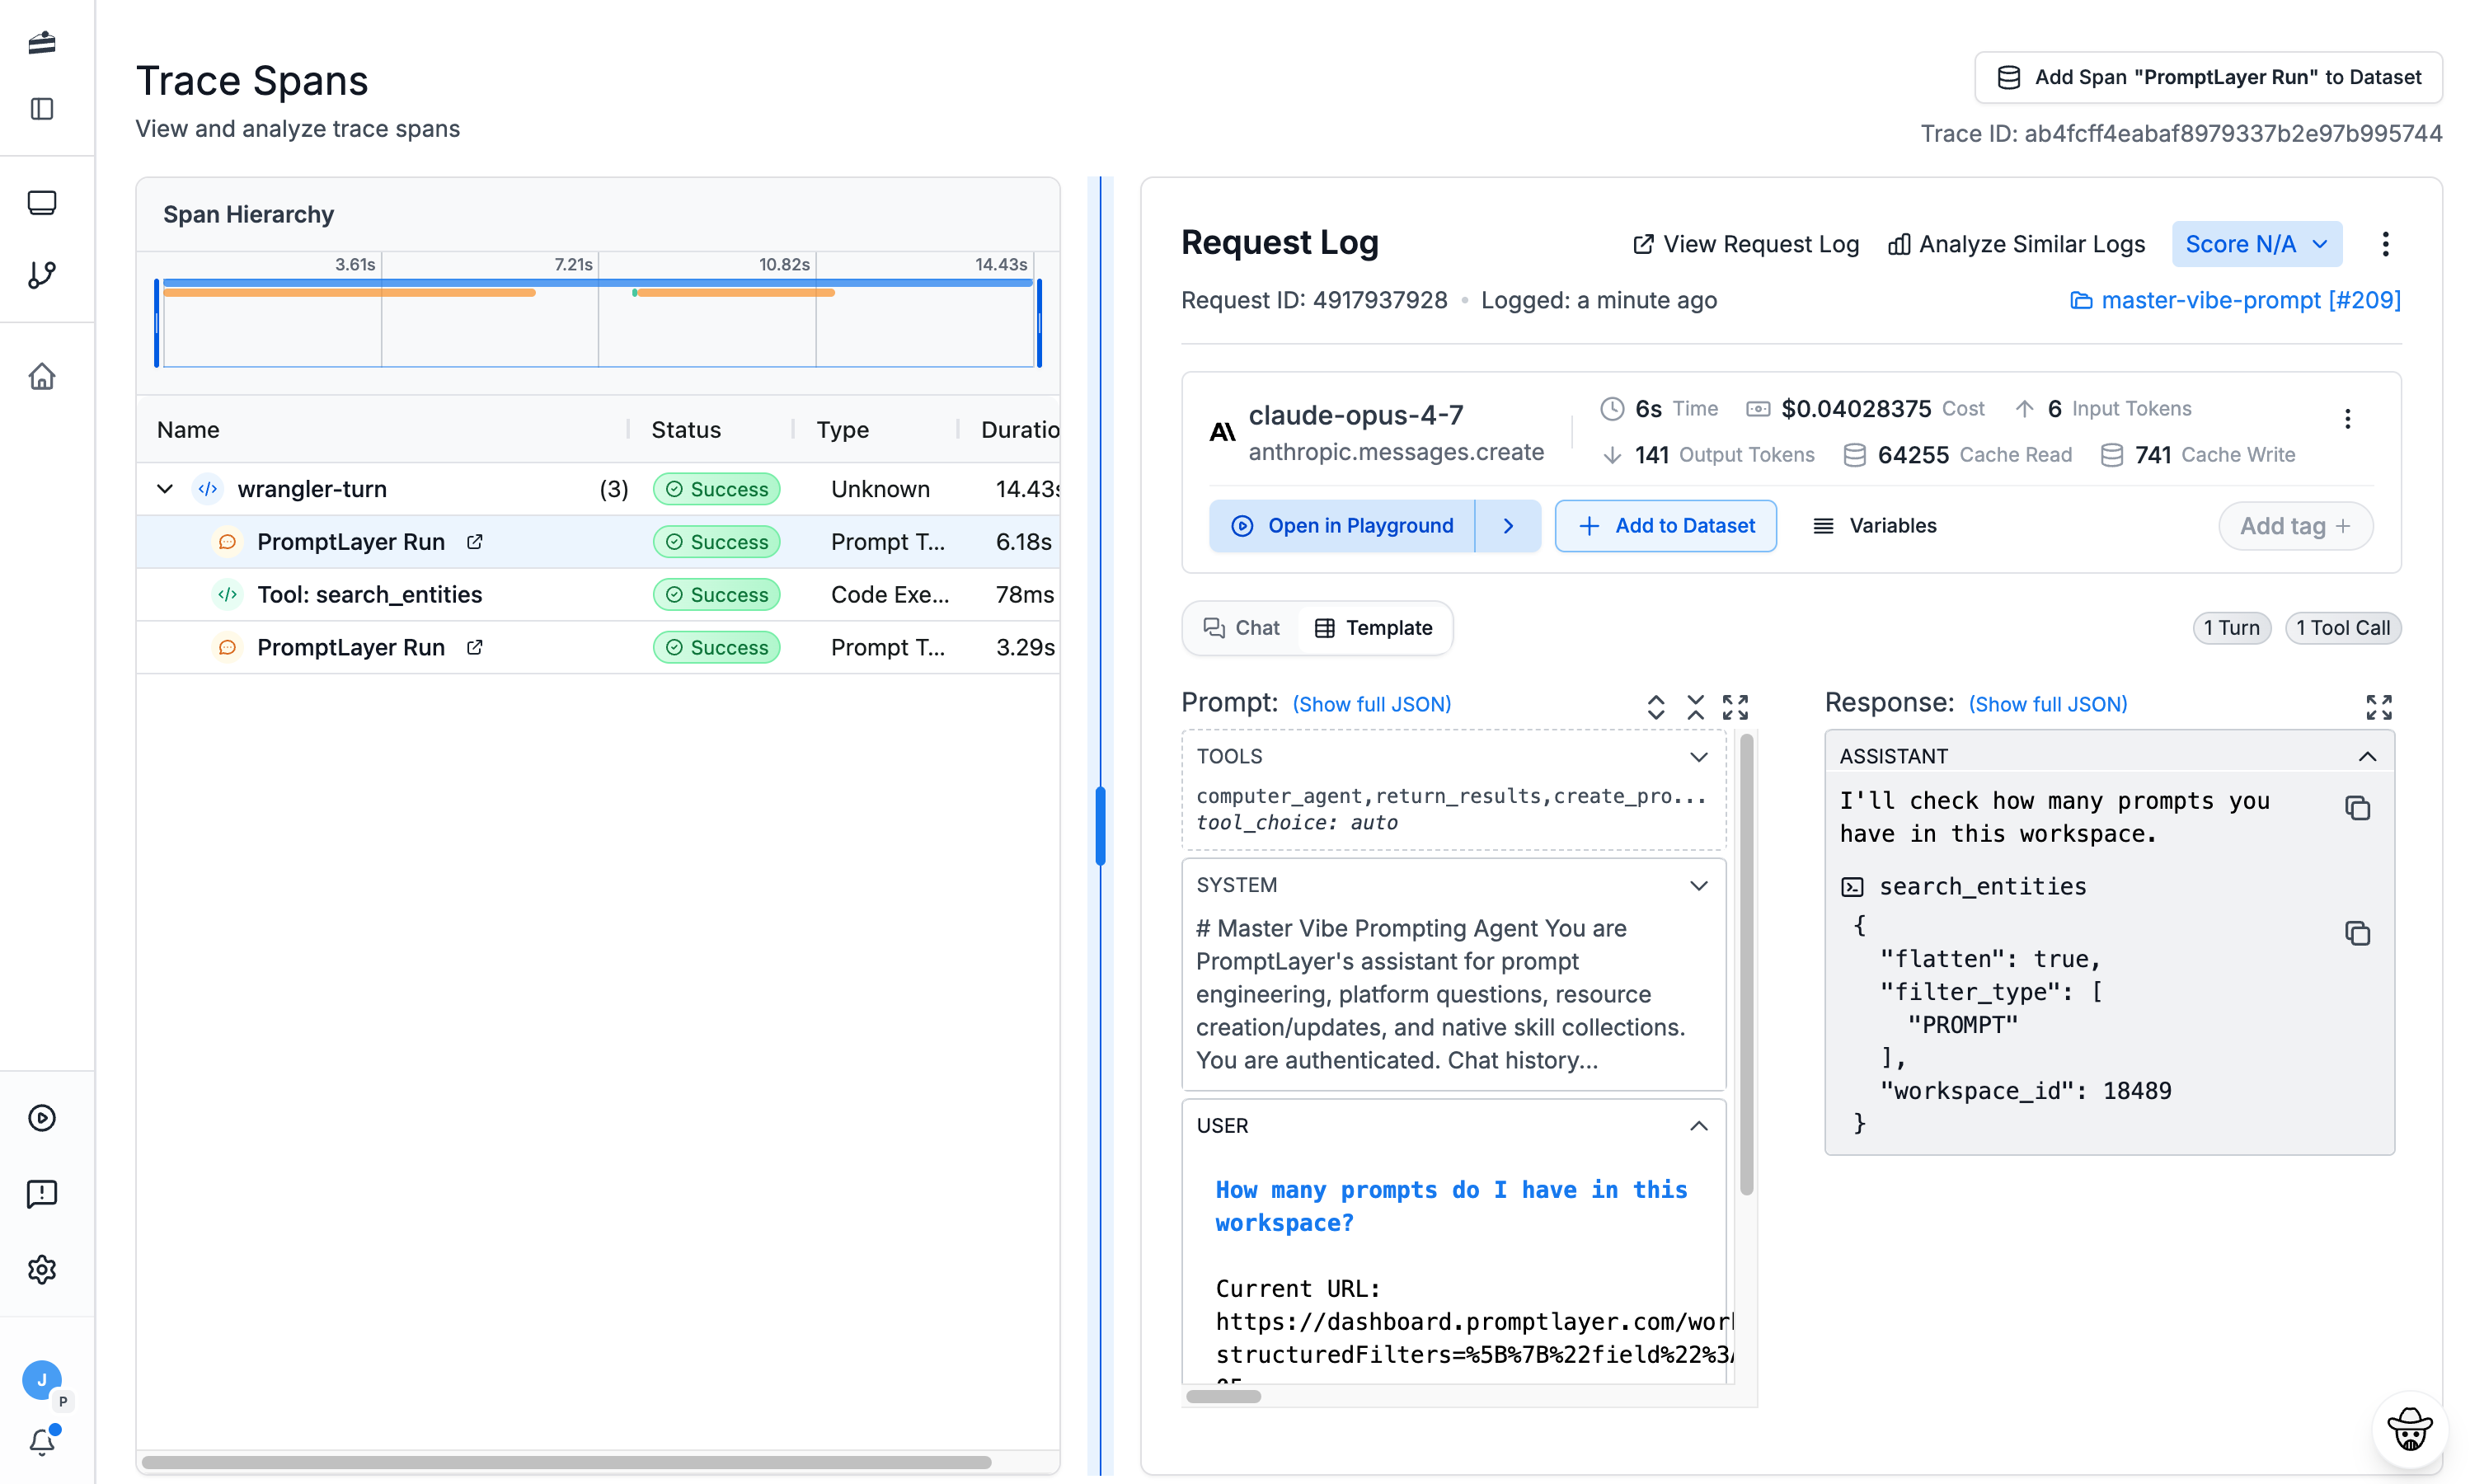
Full span traces
See the complete execution tree of every LiteLLM run — nested spans, tool calls, and LLM requests on one timeline.
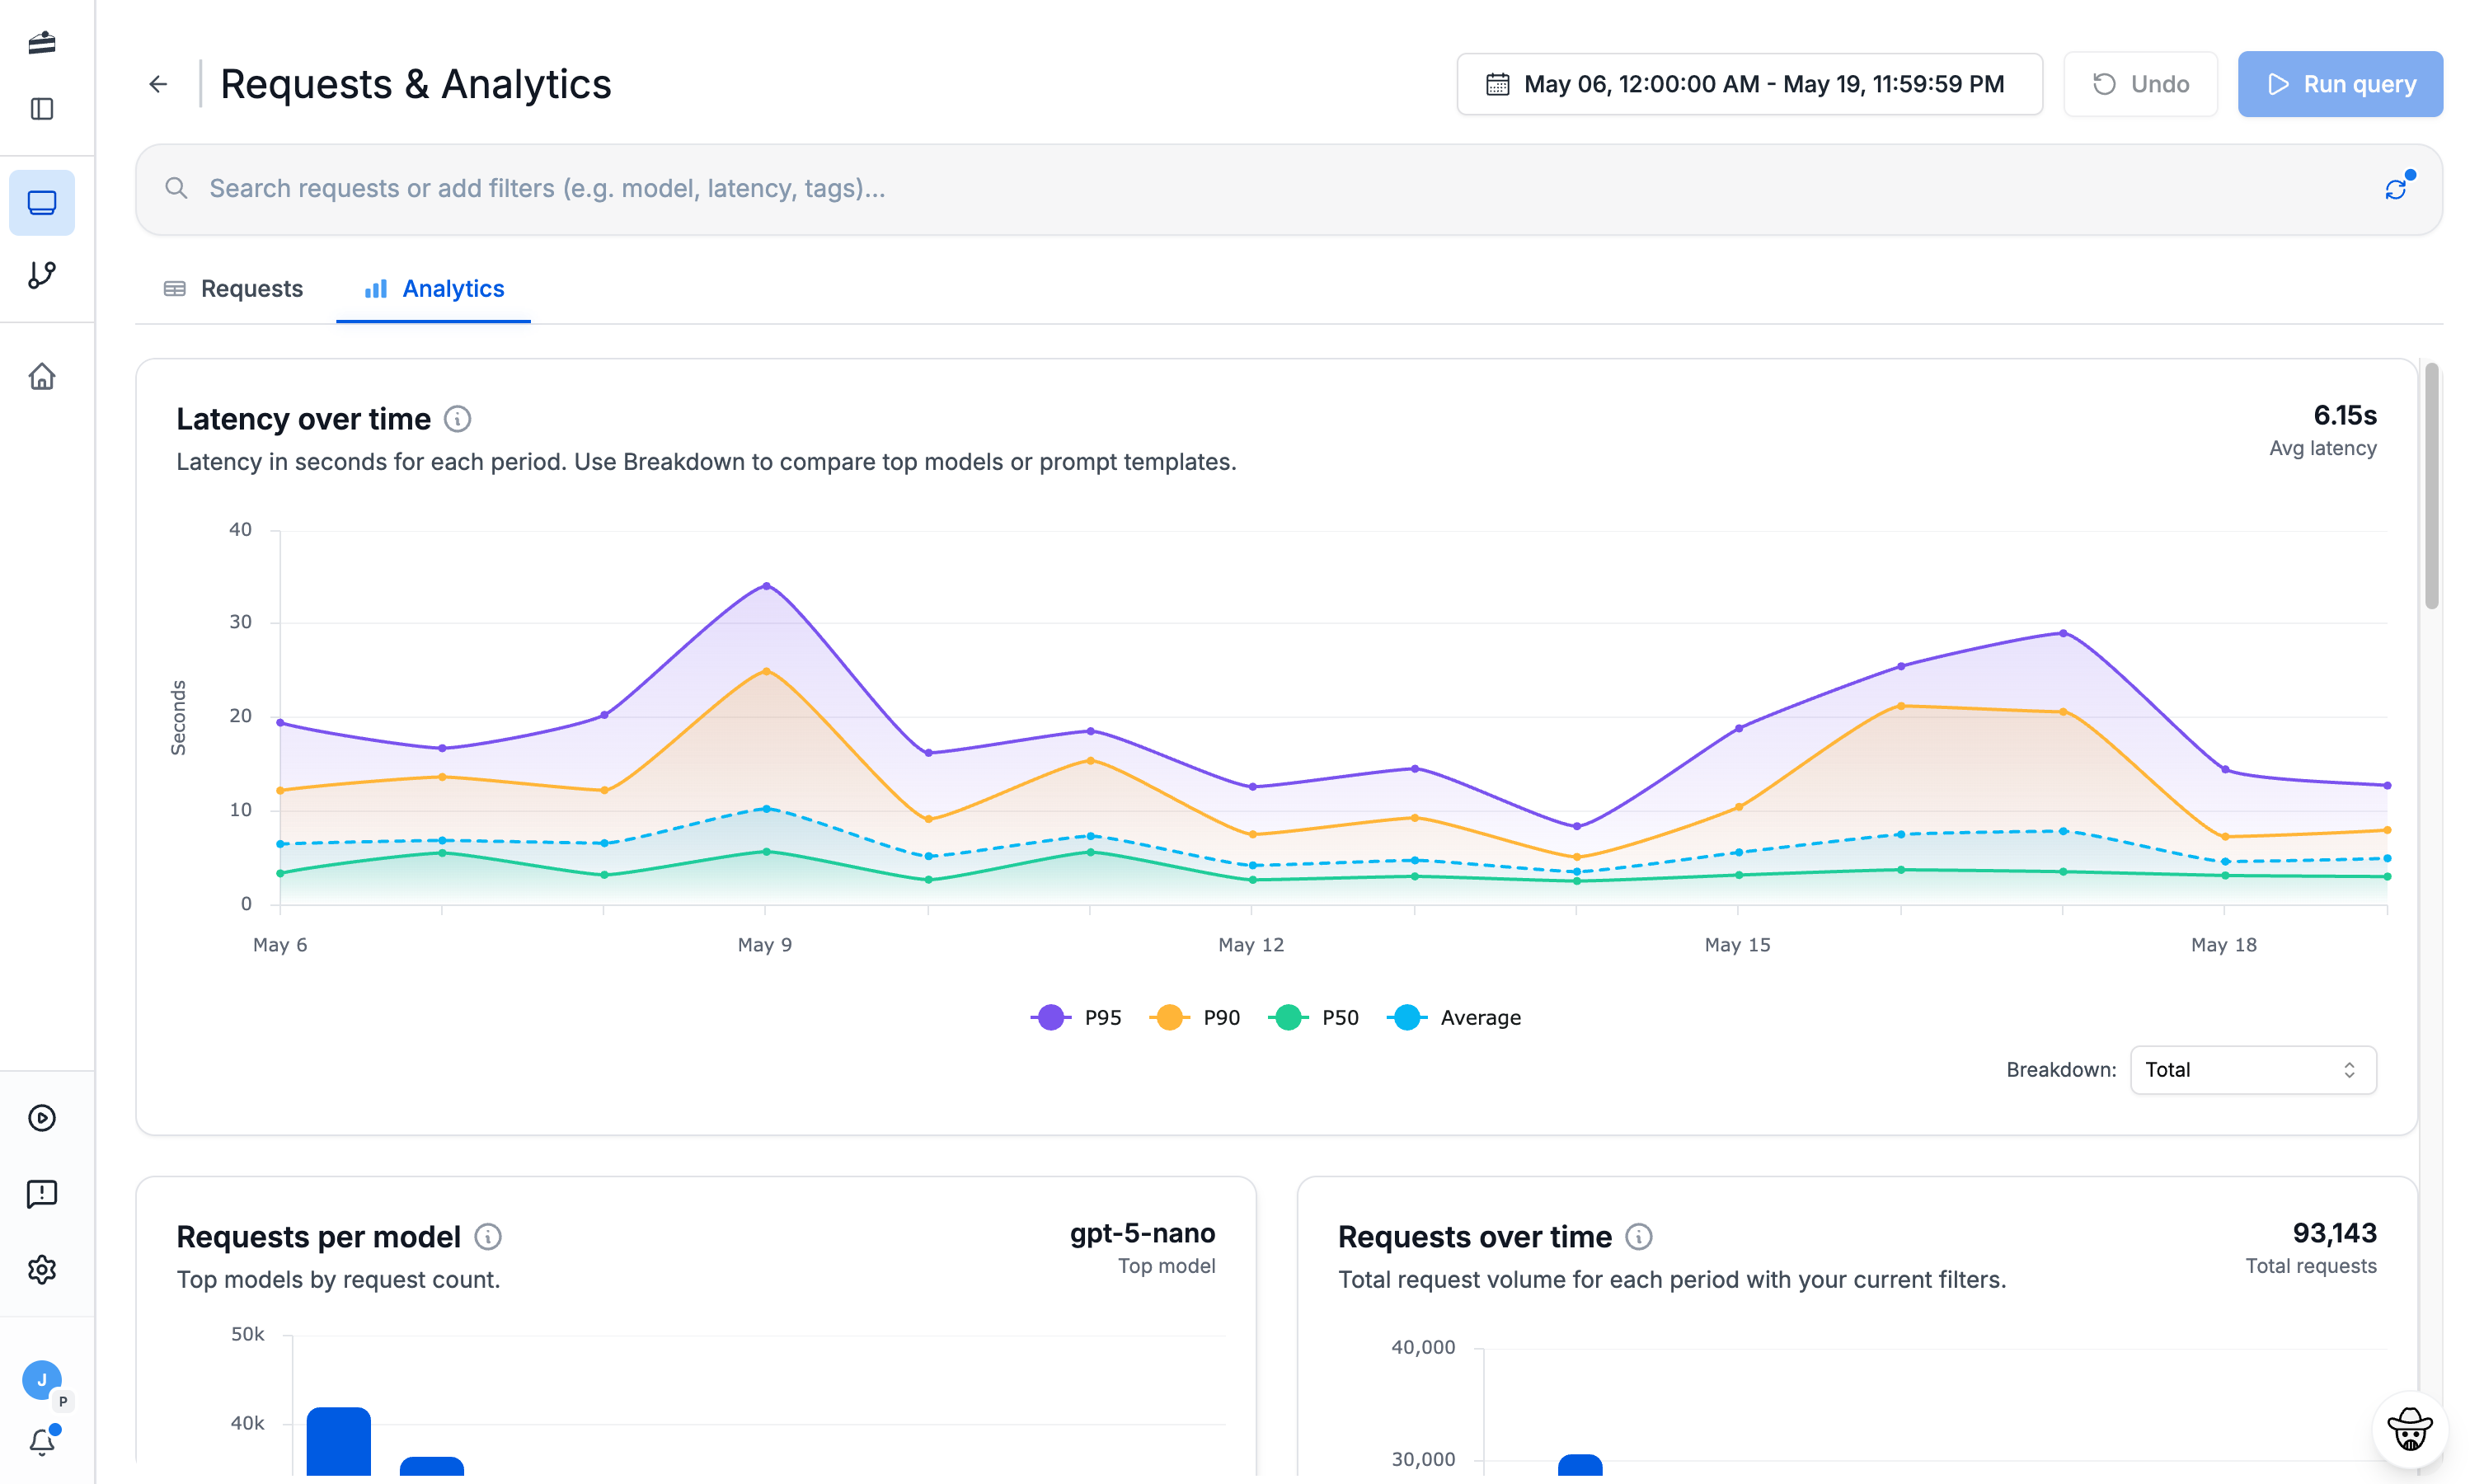
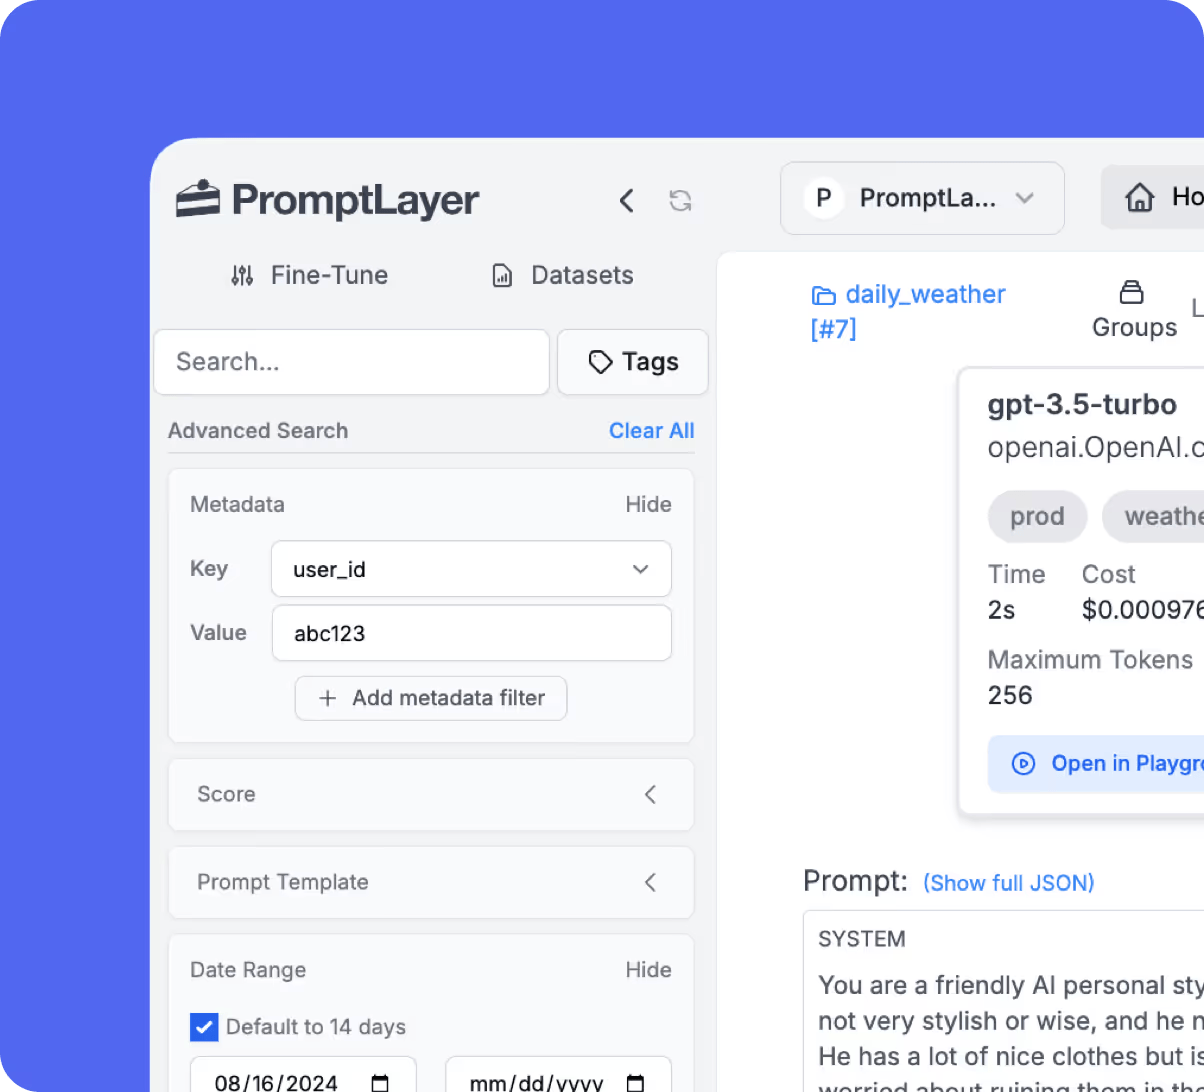
Cost & latency analytics
Track token usage, cost, and latency for every LiteLLM call, broken down by model, prompt, or metadata.
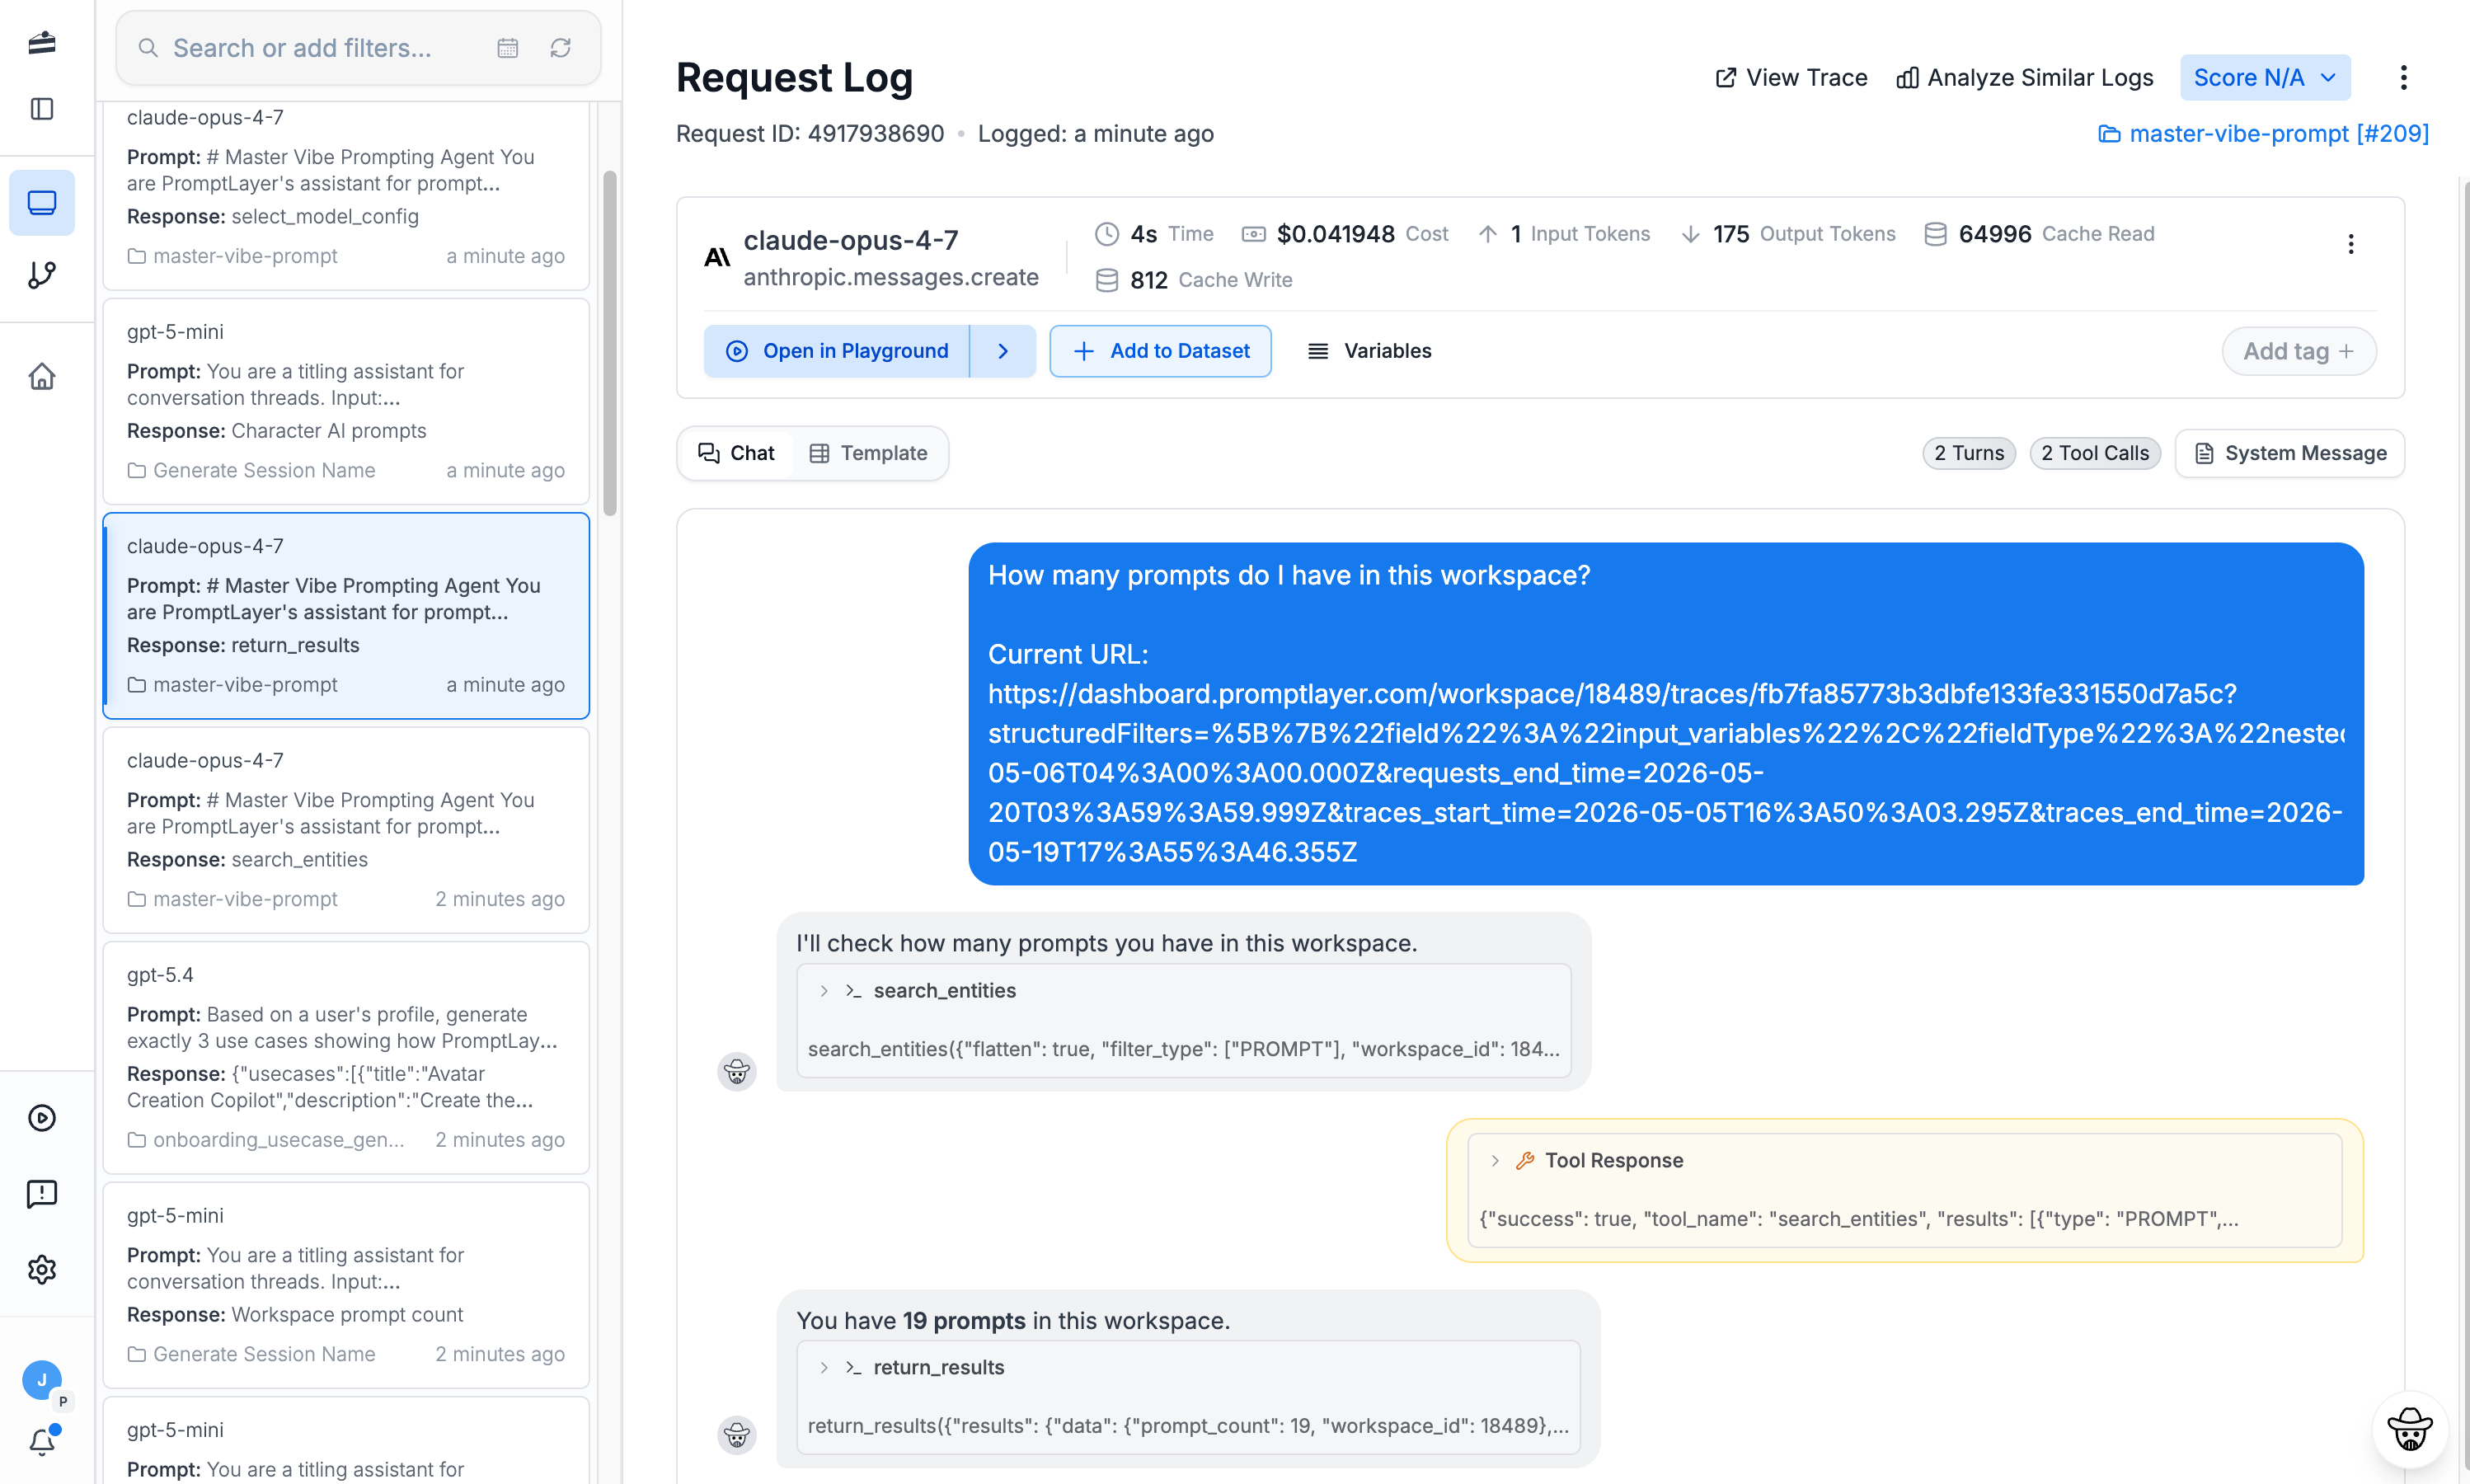
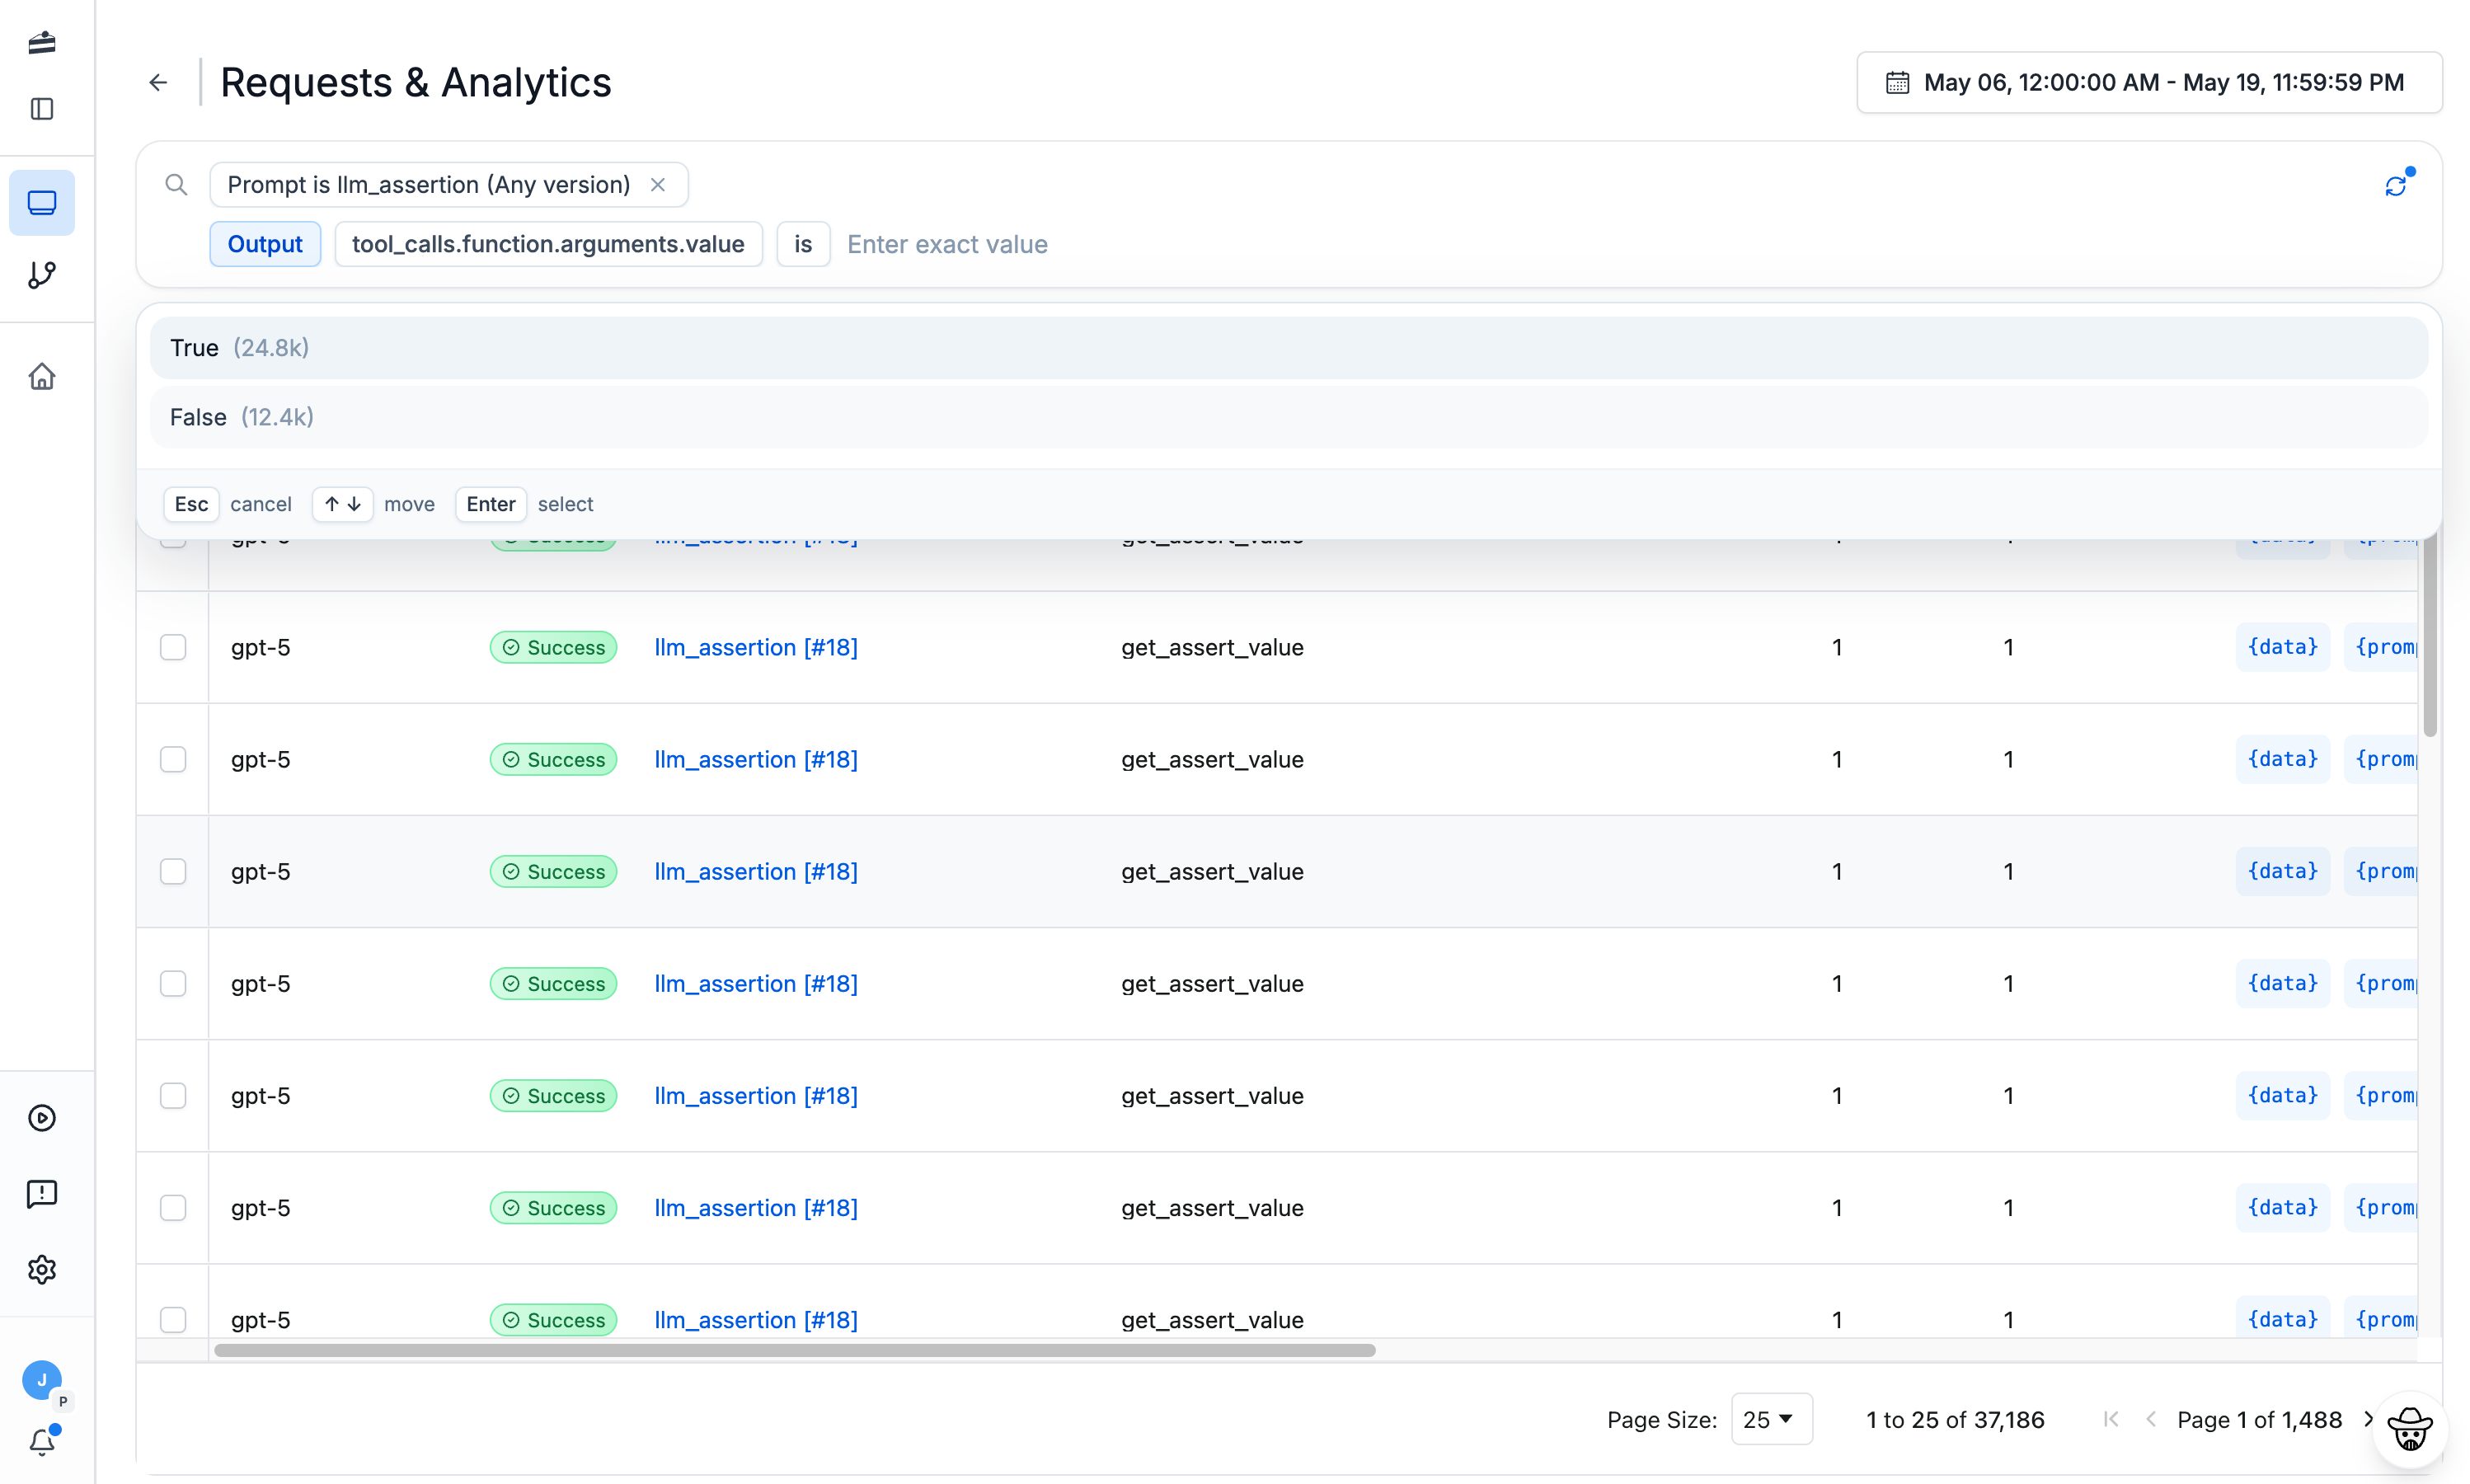
Rich metadata & search
Tag, score, and search every request. Filter production traffic by content, model, status, or custom key-value pairs.
OpenTelemetry-native
LiteLLM streams traces straight to PromptLayer's OTLP endpoint — no proxy in your request path, no SDK rewrite.
Debug in the playground
Open any LiteLLM trace in the Playground to reproduce, tweak, and fix the exact prompt that failed.
Turn traces into evals
Promote real LiteLLM runs into versioned datasets and run evaluation pipelines to catch regressions.
Understand what your LiteLLM app is doing
LiteLLM routes requests to any provider — OpenAI, Anthropic, Cohere, Bedrock and more. PromptLayer captures every routed call in one place.
See the full picture
Every LiteLLM run becomes a searchable, replayable trace — inputs, outputs, models, and timing.
Find the bottleneck
Pinpoint the slow span or expensive model call dragging down your LiteLLM pipeline.
Catch failures fast
Surface errors, failed tool calls, and low-quality outputs before your users do.
Ship with confidence
Connect traces to evaluation pipelines so every change to your LiteLLM app is tested.
Frequently asked questions
If you still have questions feel free to contact us at sales@promptlayer.com