


LLM and AI agent observability
Monitor LLMs and AI agents in production. Observe requests, traces, cost, and latency in real-time to understand how your prompts and agents are performing and where they can be improved.
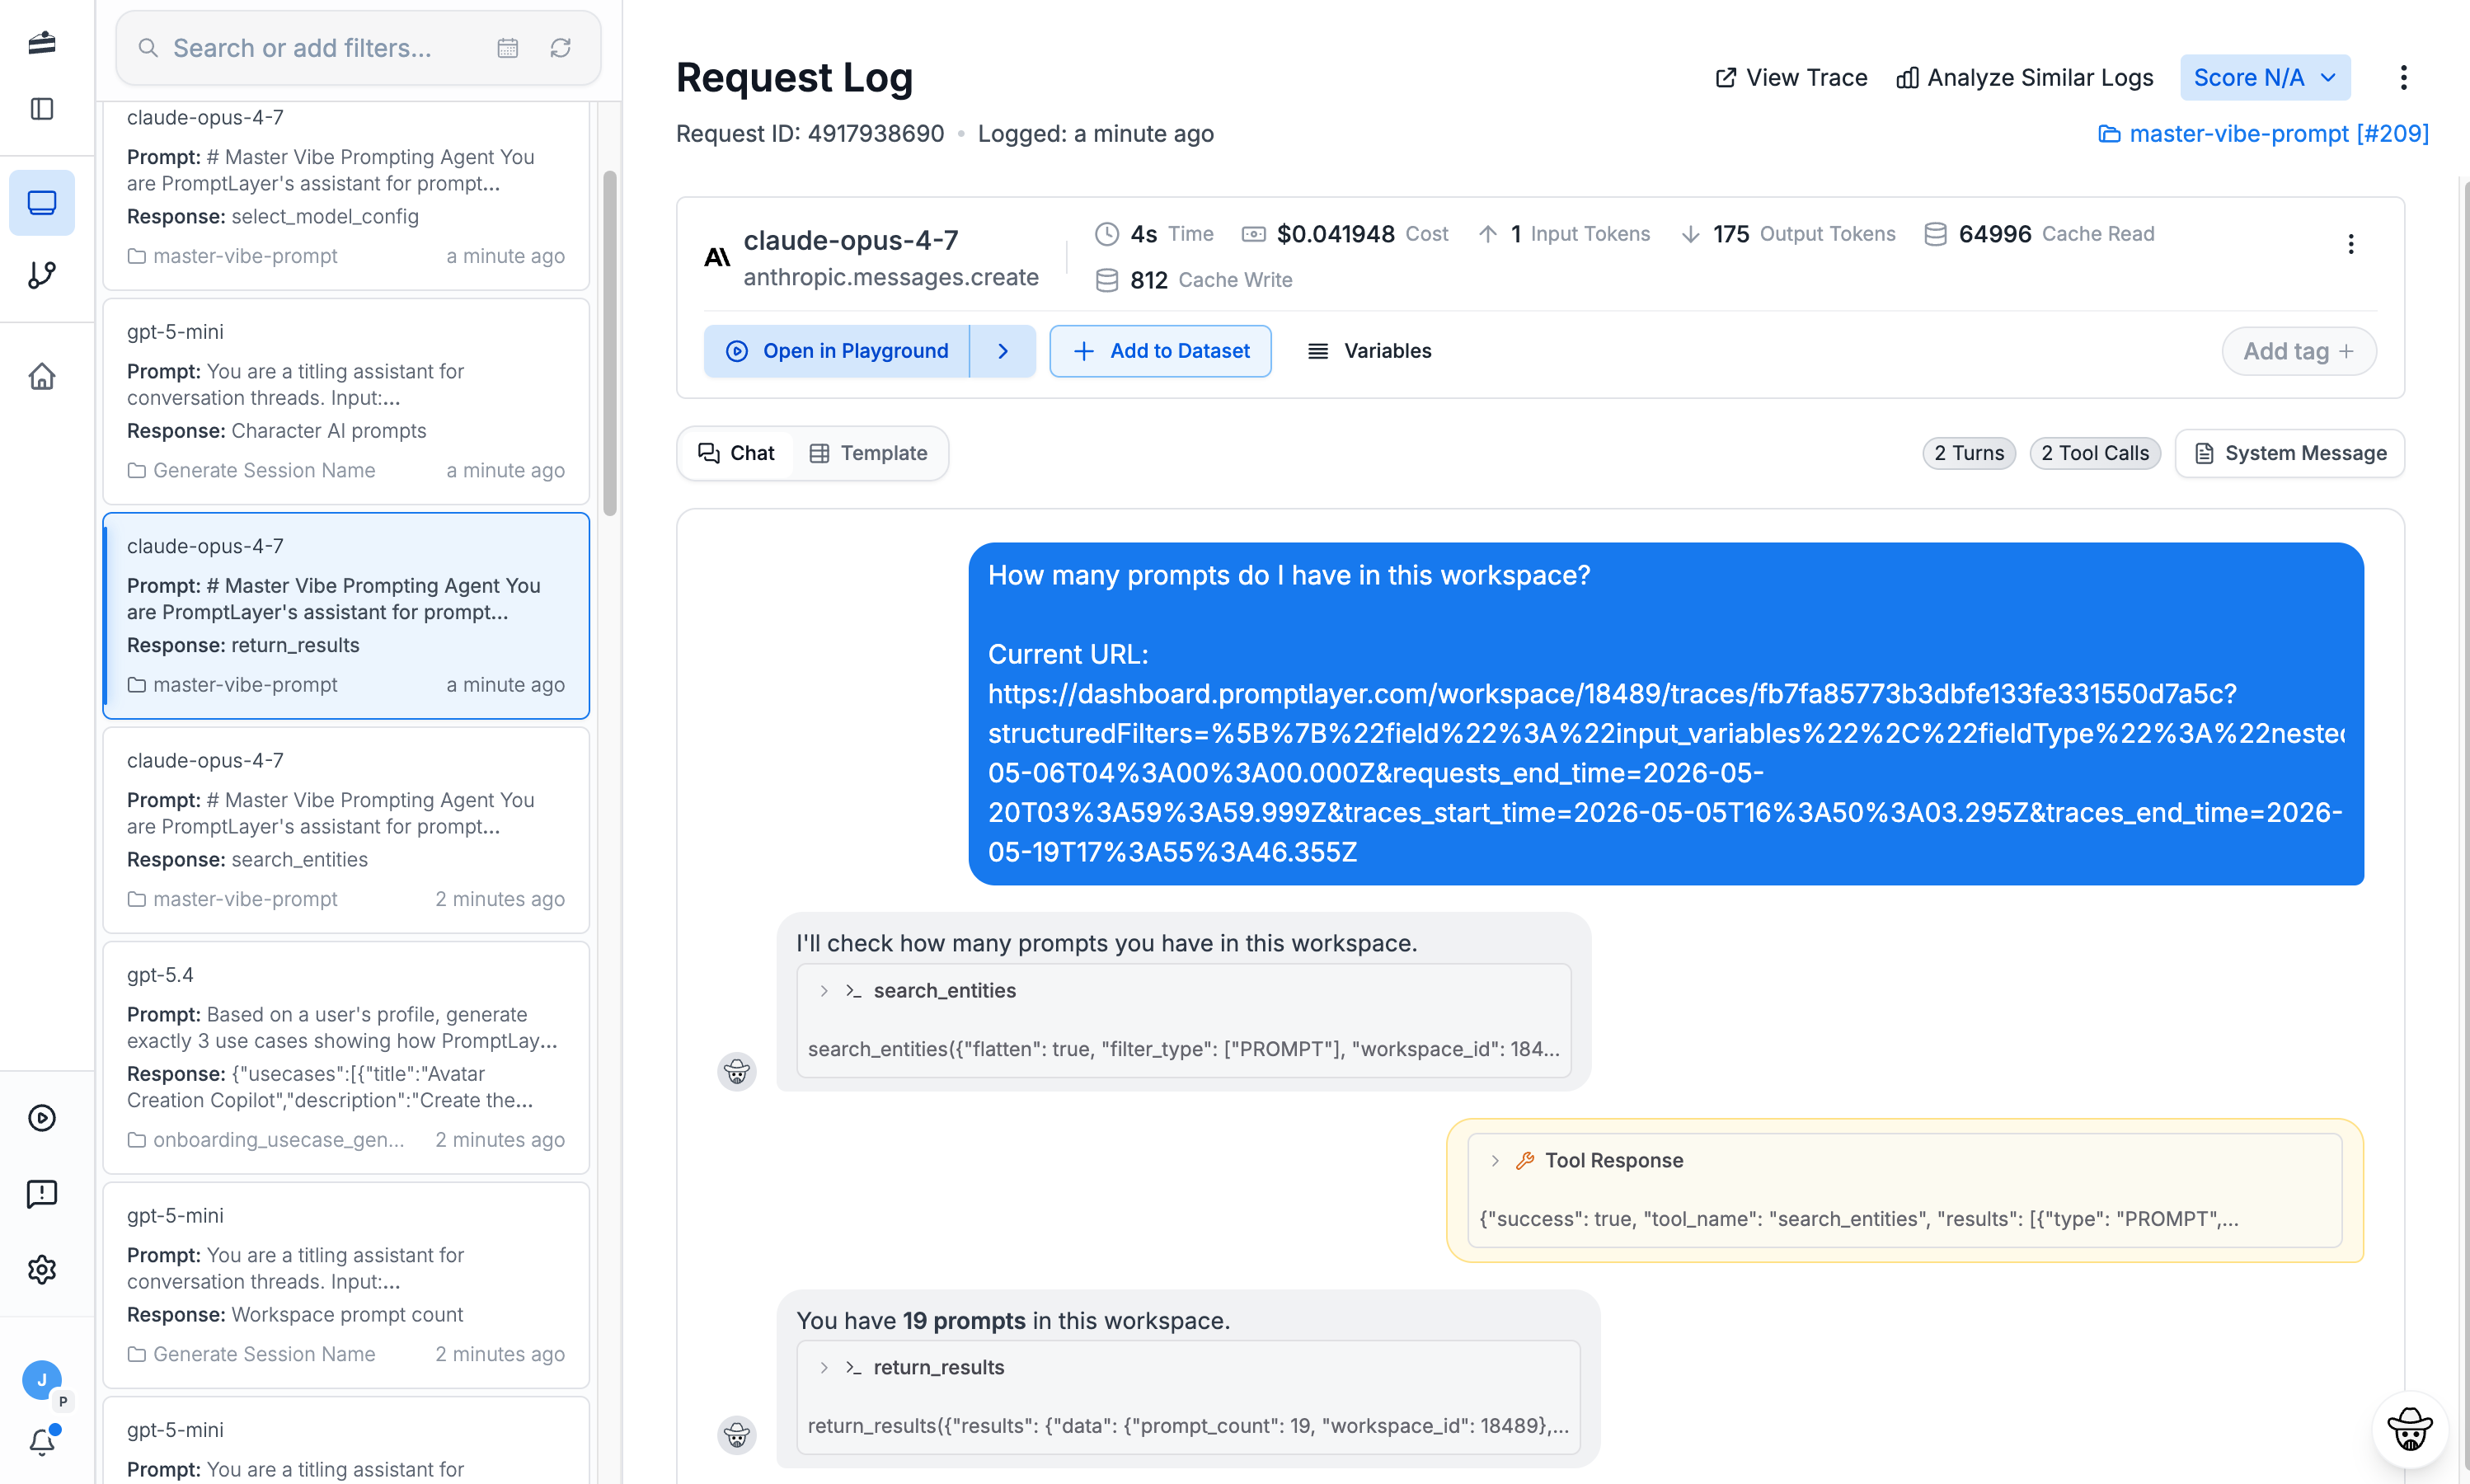
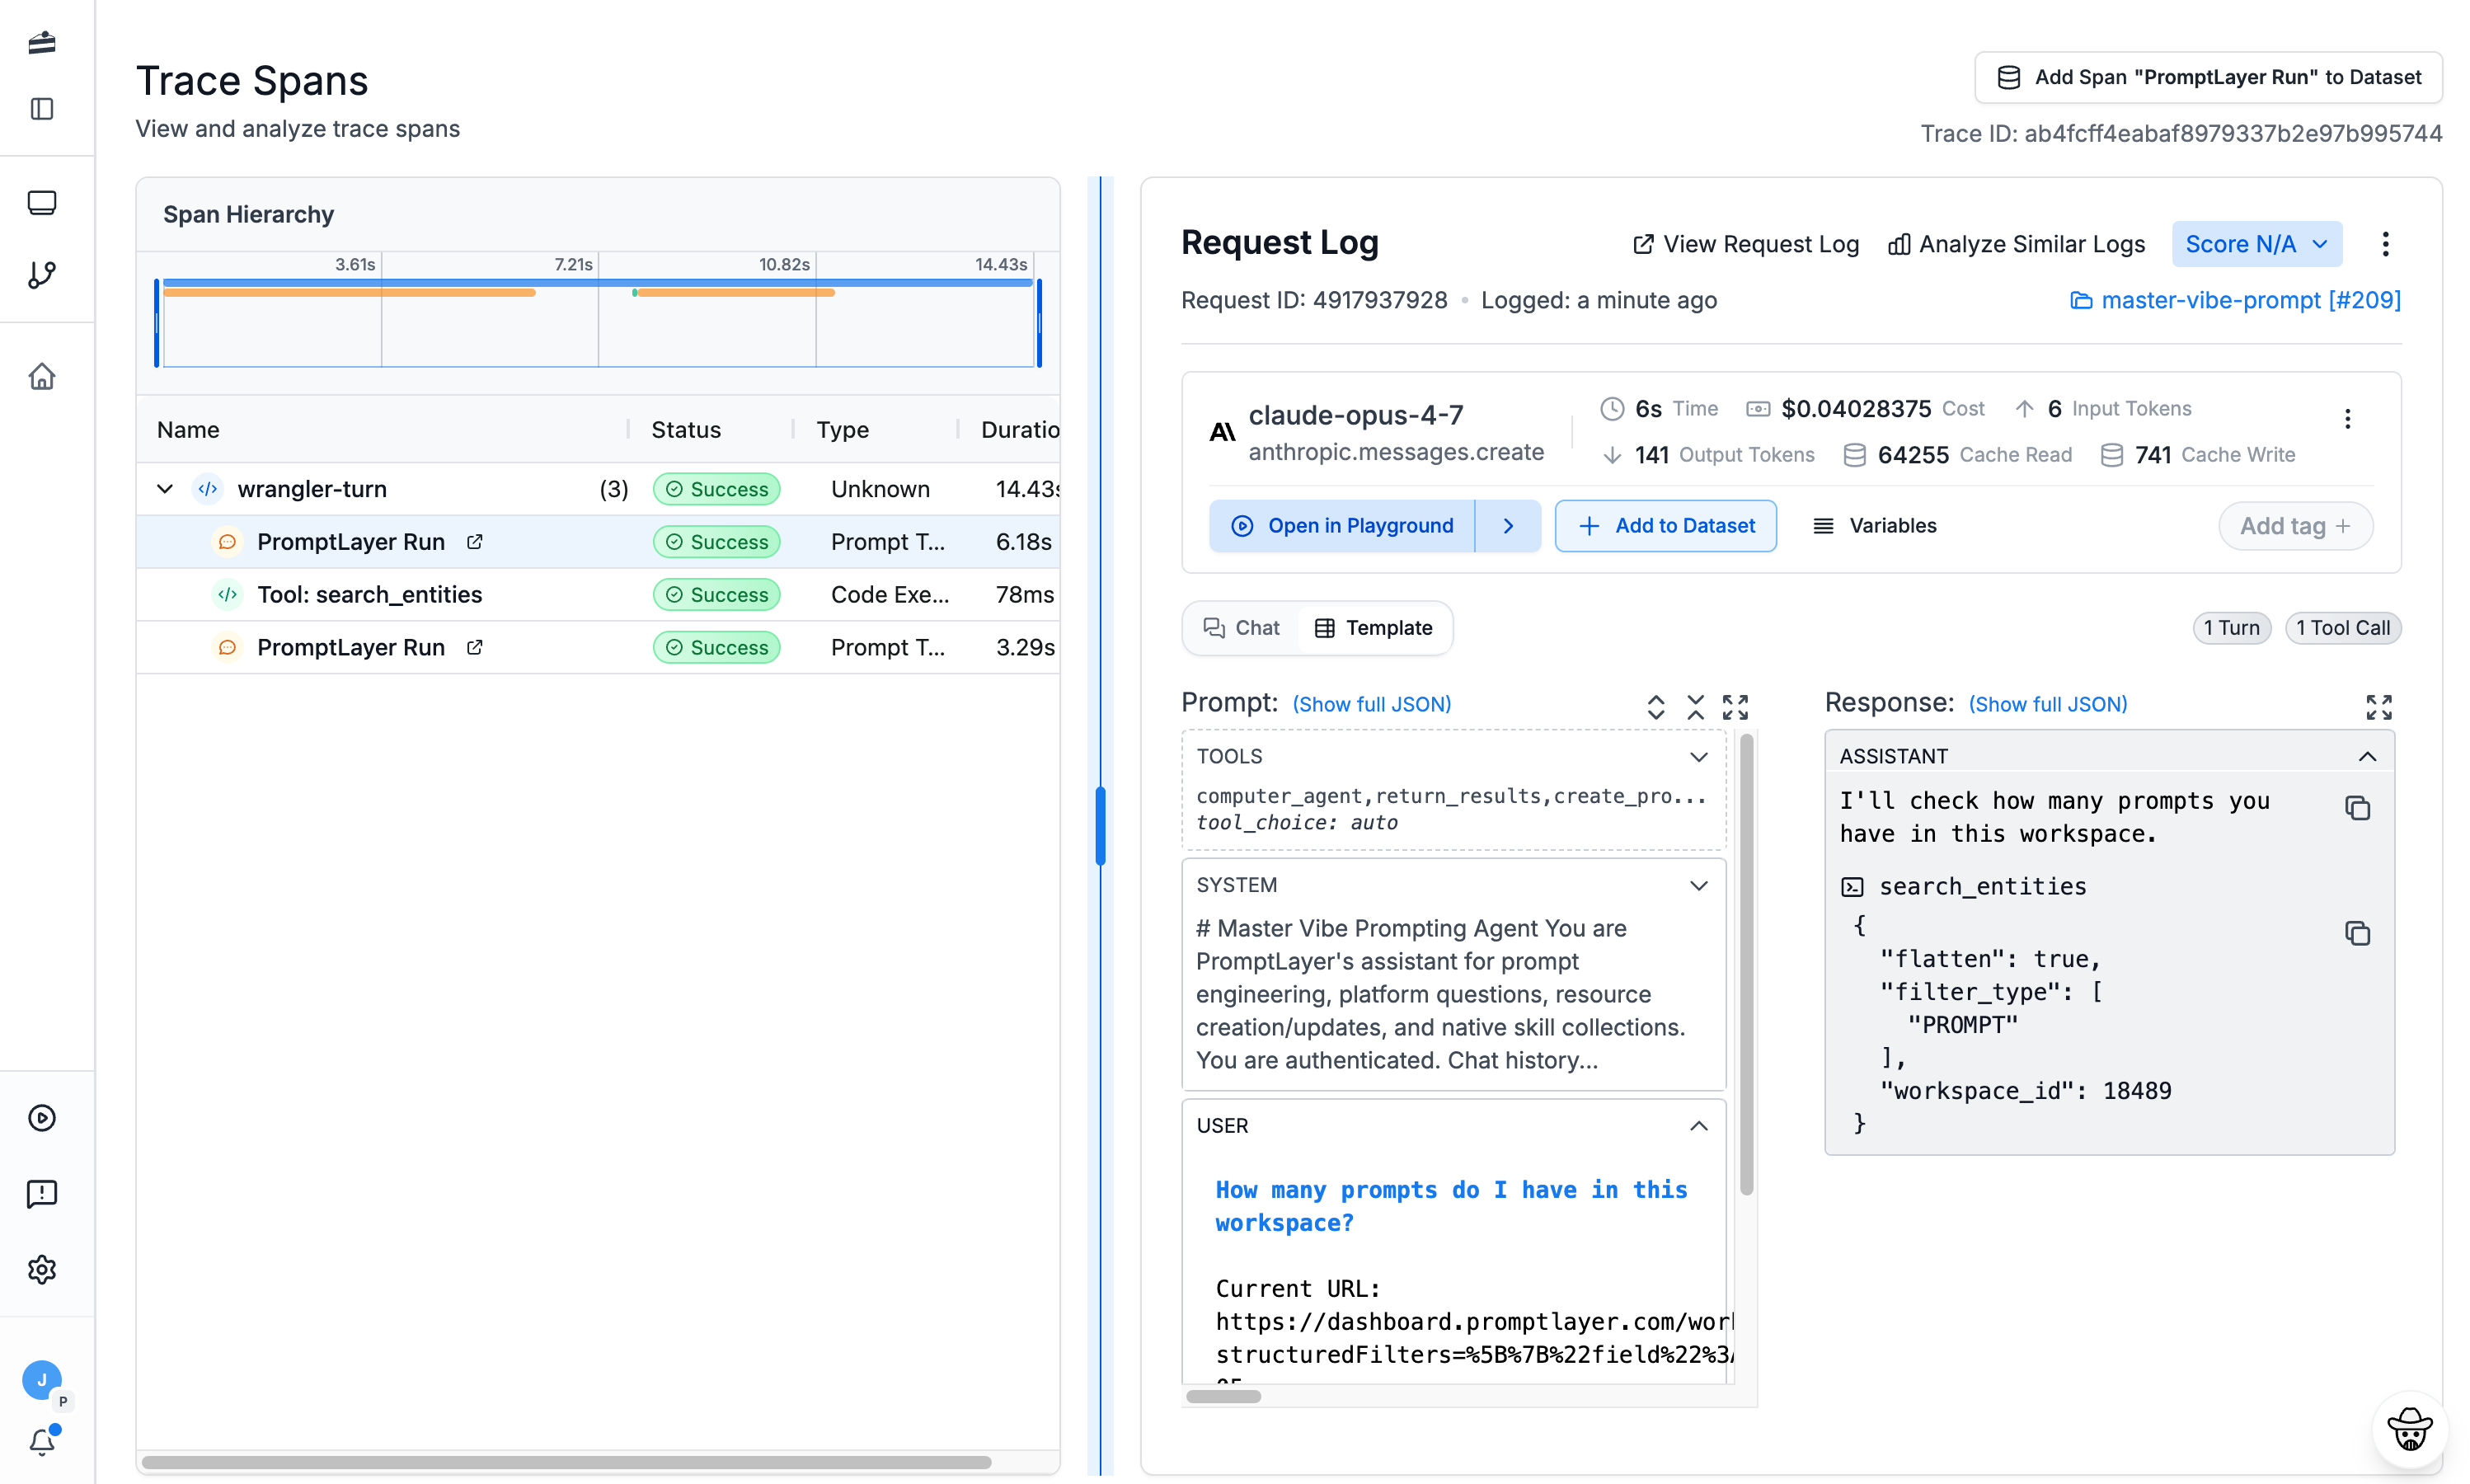
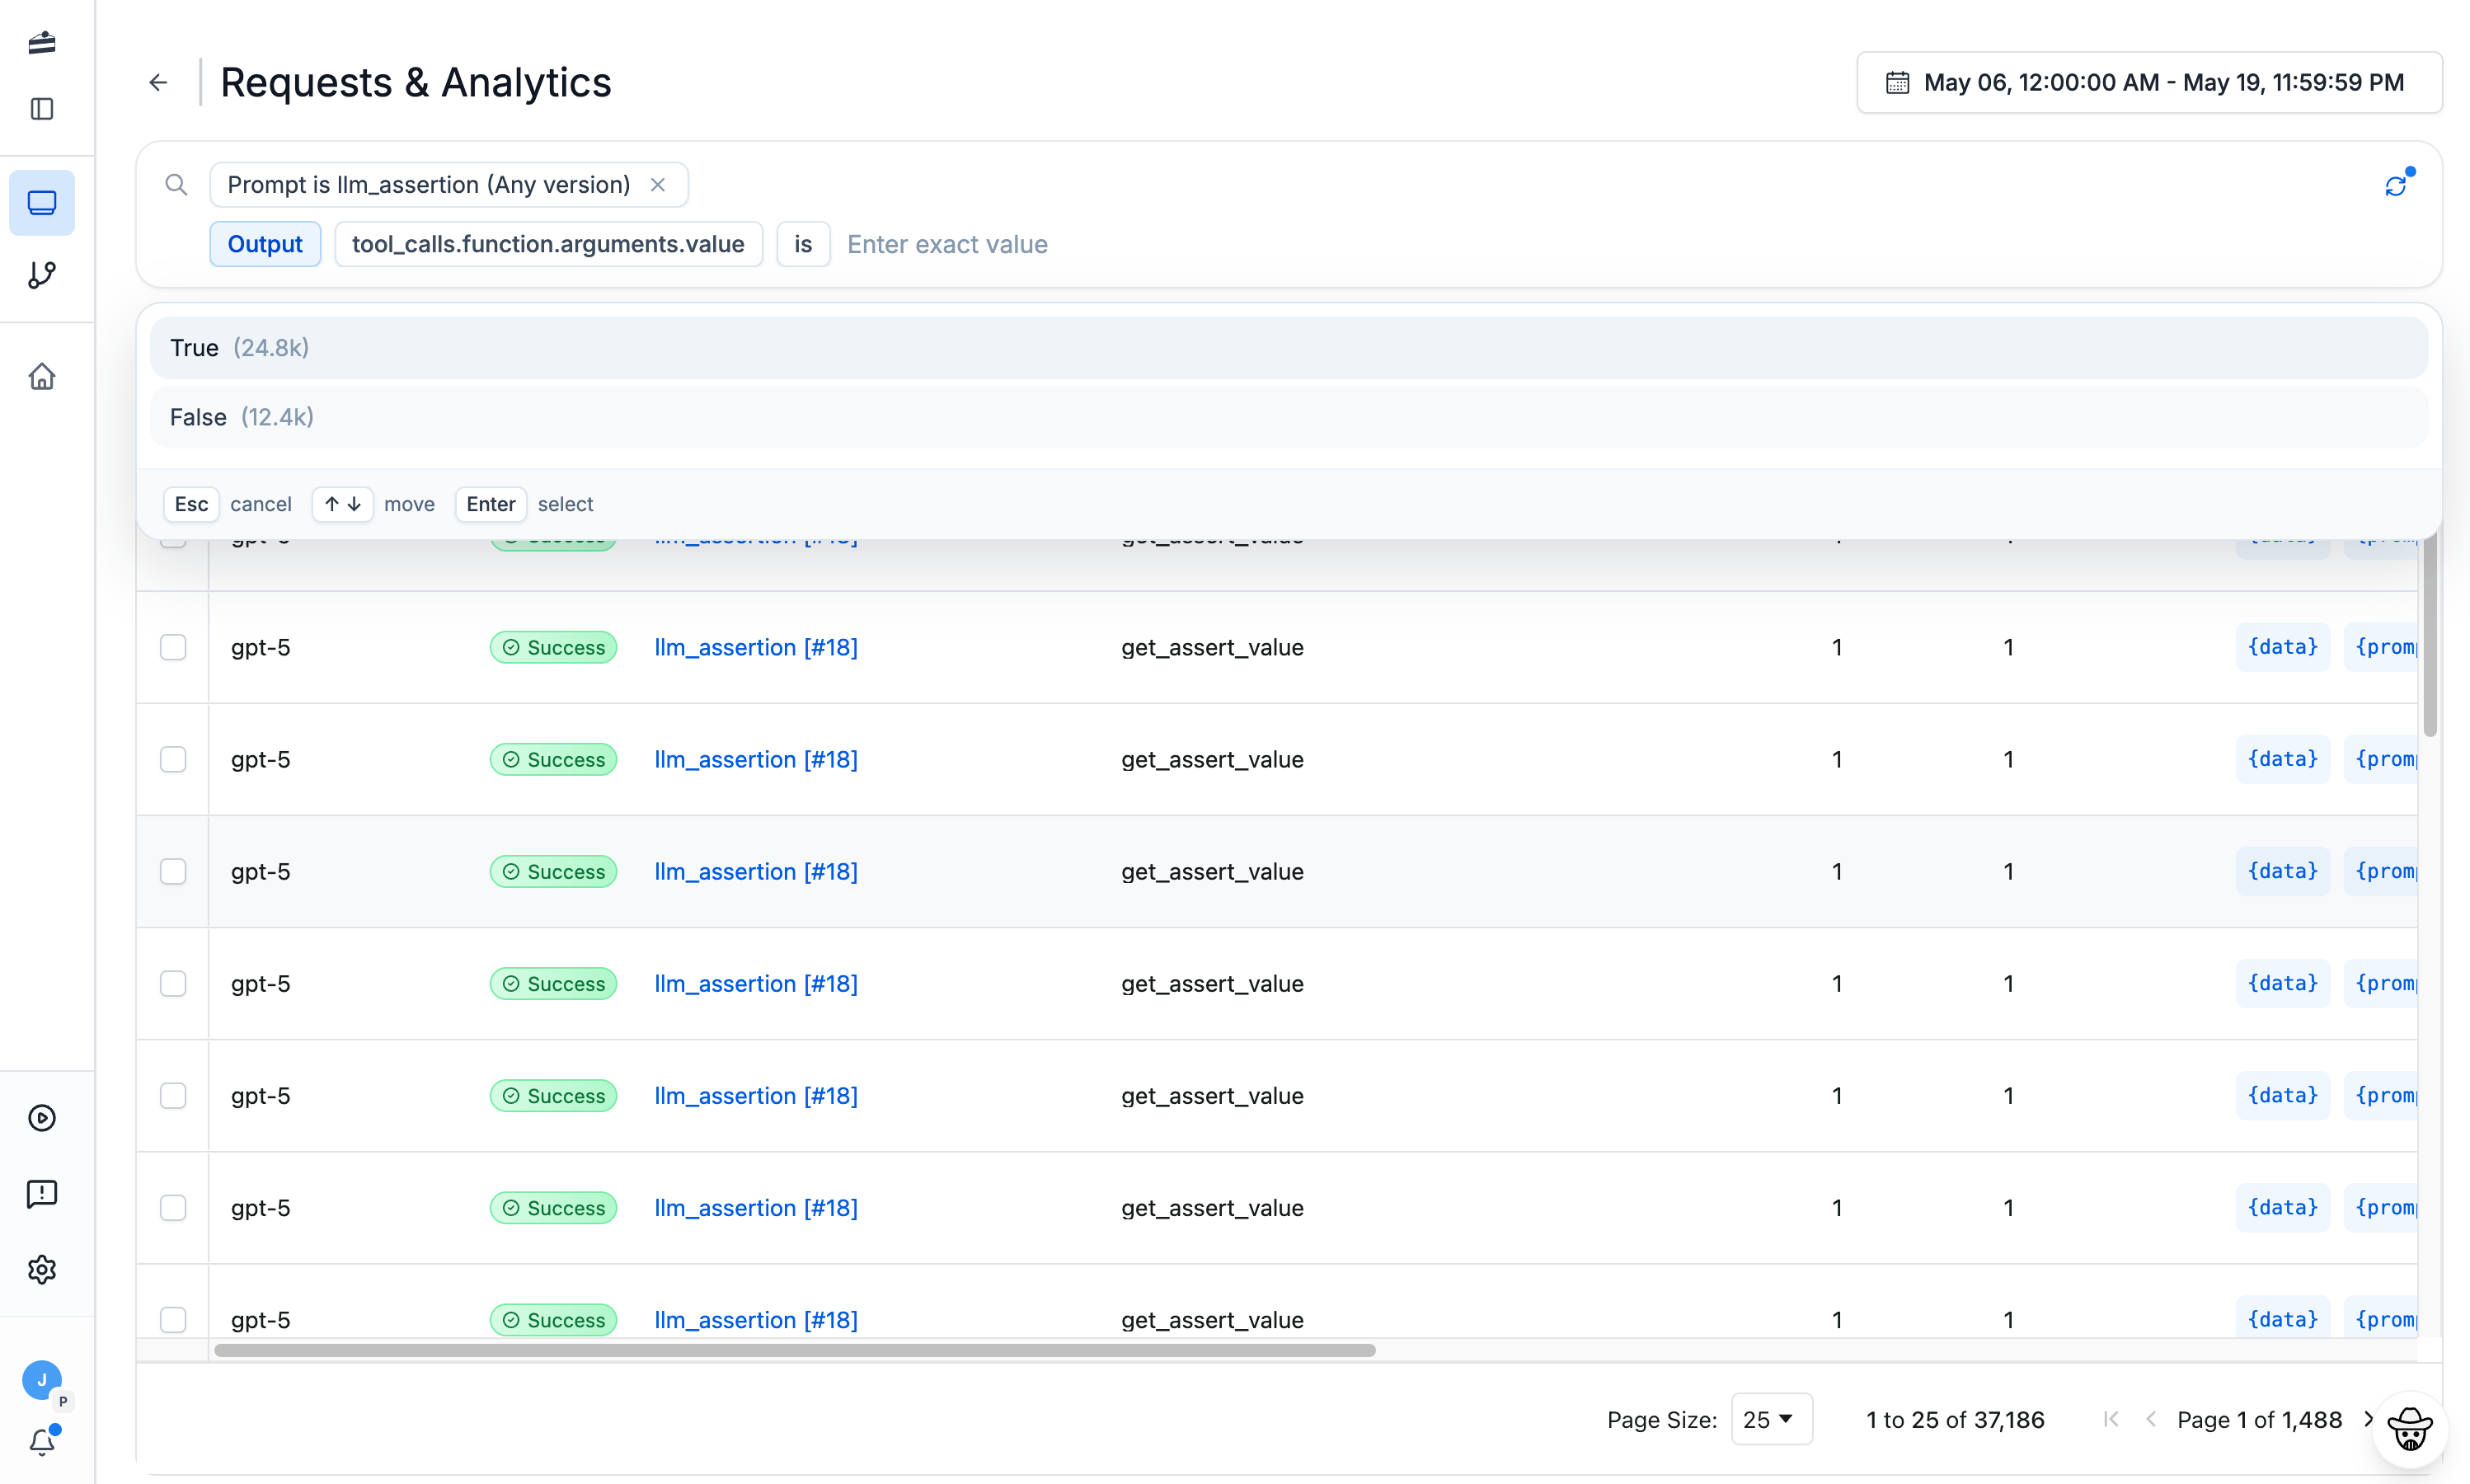
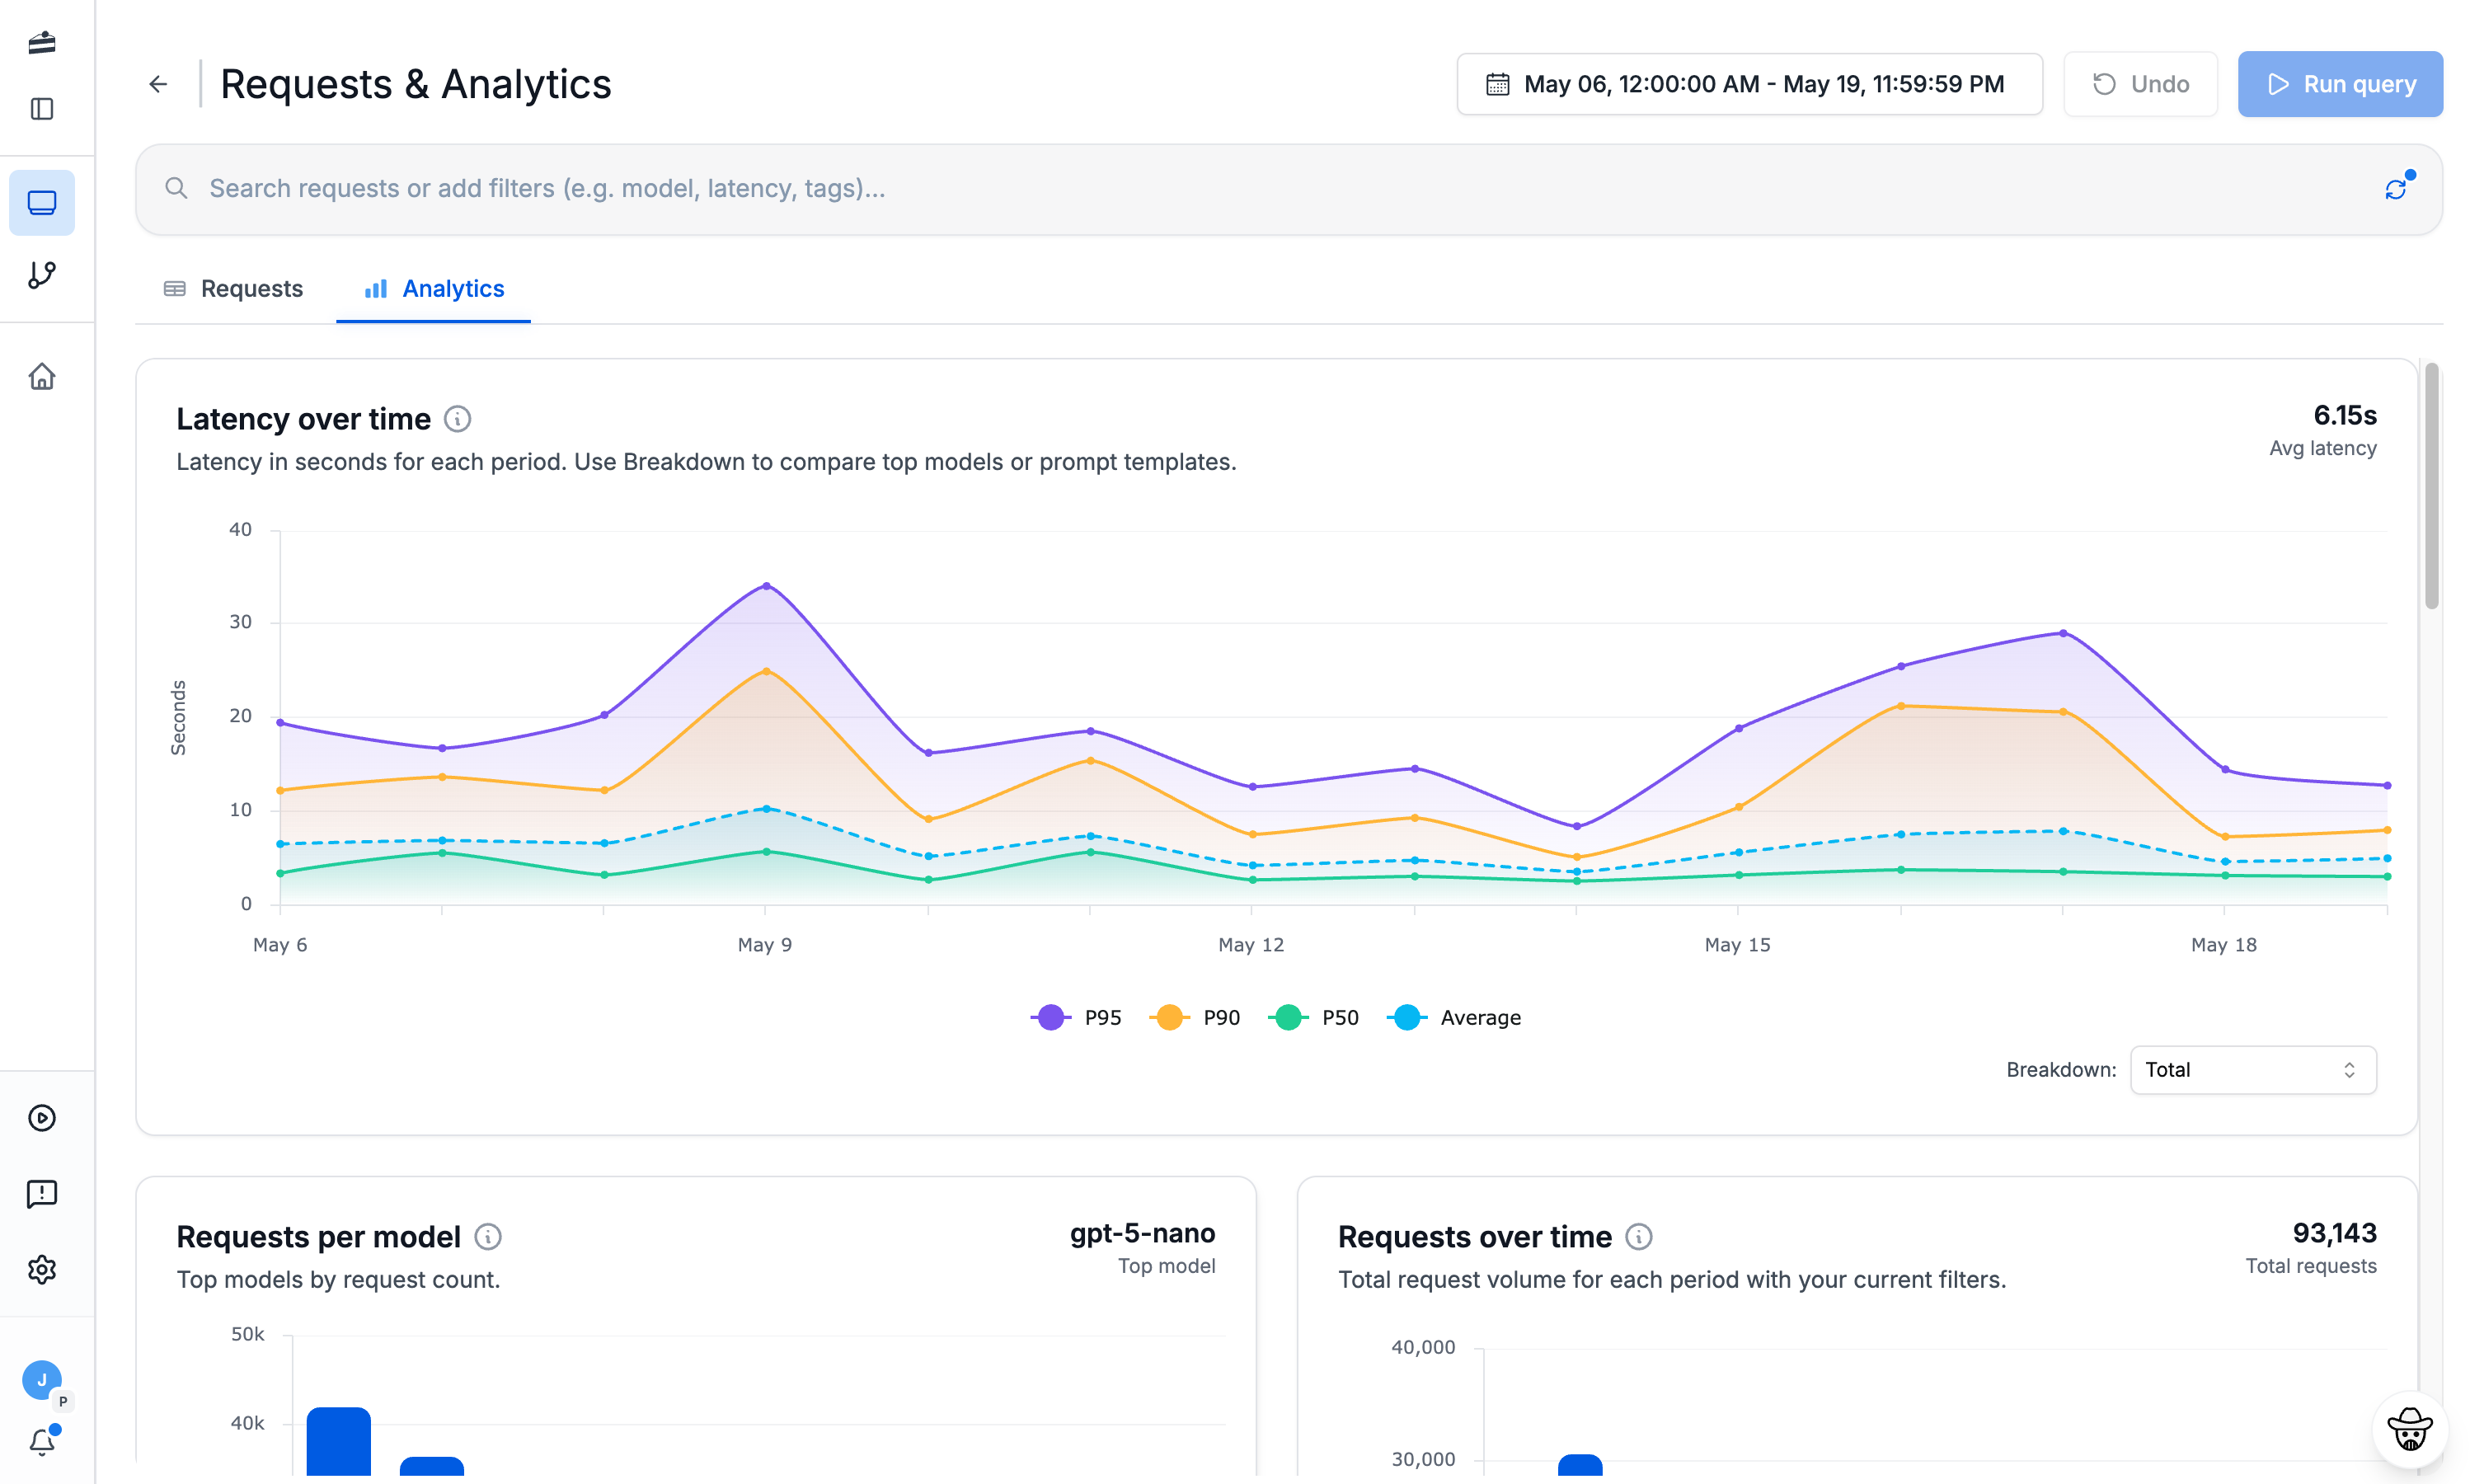
Observability that Illuminates
Observability Features
Universal Model Tracking
Track usage from any model with elegant data visualization.
Complete Metadata and Analytics
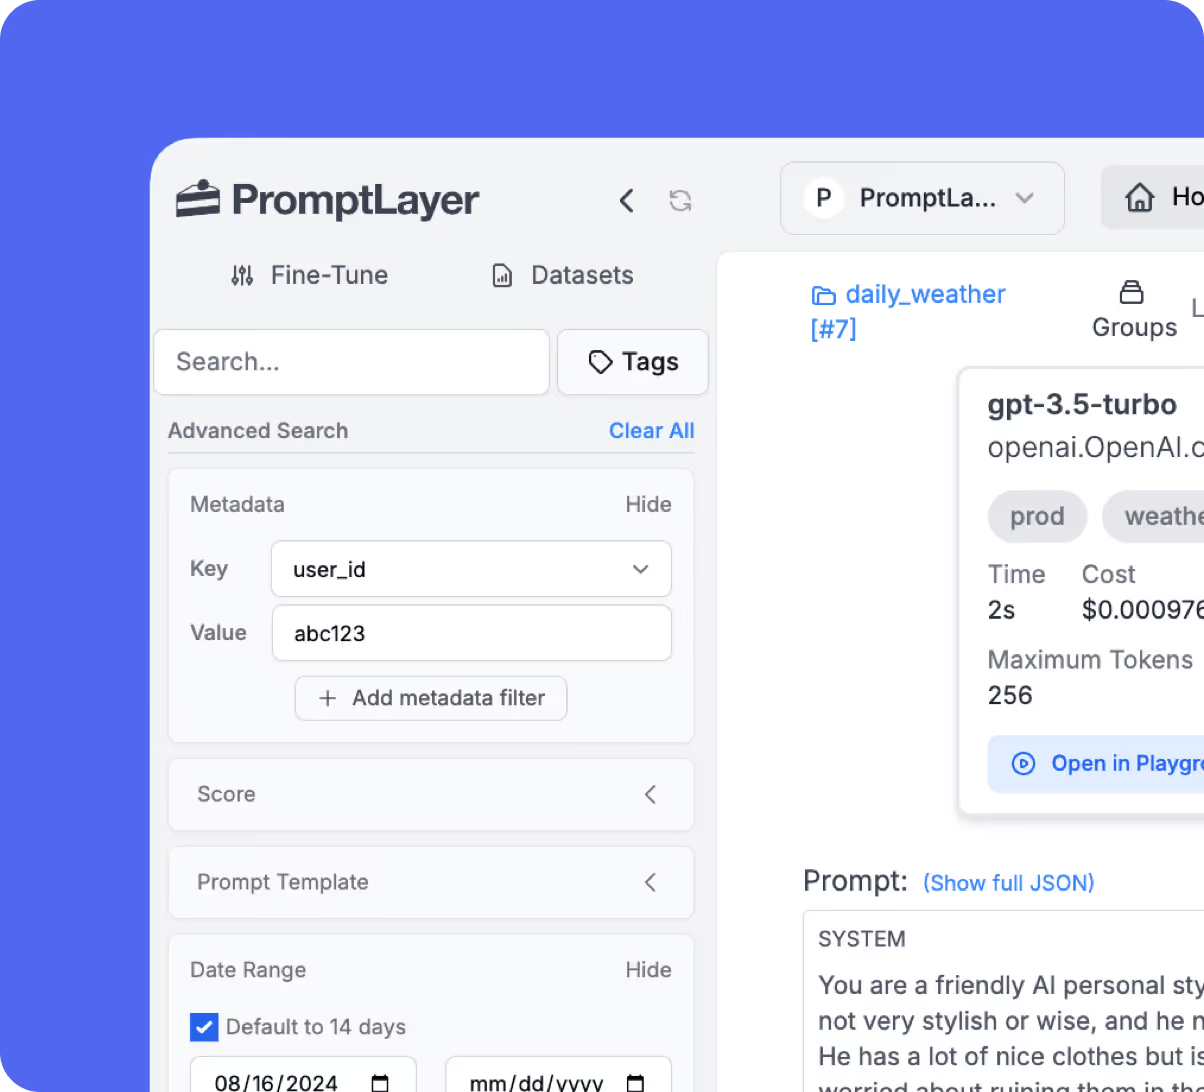
Monitor and Analyze latency, scores, tokens, and custom key-value pairs.
Prompt-Specific Insights
See which prompts and input variables were used for a request.
Full Span Support
Utilize OpenTelemetry for end-to-end function tracking around LLM calls.
Fine-Tune Models
Use historical data to fine-tune models and improve performance.
High-Performance Solution
Non-proxy design supporting millions of requests daily.
LLM Monitoring
Unravel the mystery of your LLMs
Understand how your users are interacting with your LLMs. Monitor requests, spans, cost, and latency in real-time. Use advanced analytics to analyze metrics.
Real-Time Auditing
Keep an eye on your LLMs with real-time monitoring of requests, spans, cost, and latency.
Track Analytics
Track metrics based on metadata, prompts, time, and model types.
Locate Bottlenecks
Understand where your Prompts are not performing as expected and why.
Optimize Costs
Understand the cost of your LLMs and how to optimize them.
Guide
LLM observability, explained
What is LLM observability?
LLM observability is the practice of instrumenting your language-model calls so you can see, from the outside, exactly what happened on the inside: what prompt was sent, what the model returned, how long it took, what it cost, and whether the output was any good. Traditional software emits deterministic errors and stack traces. LLMs do not. A model can return a fluent, well-formatted, completely wrong answer and never raise an exception. Without observability, that failure is invisible until a user complains.
Good LLM observability solves three problems that teams hit as soon as they ship to production. First, opaque failures: when a response is bad, you need the full input, output, and context to reproduce it, not a vague bug report. Second, cost and latency blind spots: token usage and response times drift as prompts, models, and traffic change, and you cannot manage what you cannot measure. Third, silent regressions: a prompt edit, a model version bump, or a provider-side change can quietly degrade quality across thousands of requests before anyone notices.
The foundation is logging every request with its complete input and output, then enriching each log with metadata: which prompt version, which model, which user, which environment. PromptLayer logs each LLM request with full input/output and ties it to the exact prompt version that produced it, so a regression traces straight back to the change that caused it. That link between a log line and a versioned prompt is what turns raw request logs into an observability system rather than a firehose.
LLM observability vs. monitoring vs. tracing
These three terms get used interchangeably, but they describe different things, and the distinction matters when you evaluate LLM monitoring tools.
Monitoring answers "is the system healthy right now?" It watches known, pre-defined signals — error rate, p95 latency, cost per hour, requests per minute — and alerts when they cross a threshold. Monitoring is necessary but shallow: it tells you that something broke, not why.
Tracing captures the causal path of a single request as it moves through your system: the prompt template, the variables filled in, retrieval steps, tool calls, and the final generation. For a single LLM call the trace is short; for an agent it can span dozens of steps. Tracing is what lets you reconstruct a specific failure end to end.
Observability is the superset. It combines request-level logging, tracing, and aggregate monitoring so you can move fluidly from a dashboard anomaly ("cost spiked at 2pm") down to the individual traces that caused it, and back up to a trend. The practical test of a real LLM observability platform, versus a thin monitoring tool, is whether you can pivot from an aggregate metric to the exact requests behind it without leaving the product. PromptLayer's searchable request logs and evaluations are built for exactly that drill-down.
What to track: cost, latency, tokens, and quality
Once you decide to instrument your stack, the question becomes what to actually capture. Four categories cover most production needs.
Requests (the raw log). To log LLM API requests properly, record the full prompt sent, the full completion returned, the model and provider, and a timestamp. Attach custom metadata — user ID, session ID, feature flag, environment — so you can slice later. Most platforms give you a wrapper around your existing client or a REST endpoint; PromptLayer offers both an SDK and a REST API so you can log from any language or runtime. The rule of thumb: capture more metadata than you think you need, because you cannot query a dimension you never recorded.
Token usage and cost. To track LLM token usage costs, log prompt tokens and completion tokens per request and map them to per-model pricing. Cost problems almost always come from a few culprits: a prompt that grew a bloated system message, an agent that loops, or a switch to a pricier model. Per-request token counts rolled up into usage-analytics dashboards make those patterns obvious. PromptLayer tracks cost and token usage per request and per prompt version, so you can compare the cost of version 12 against version 13 directly.
Latency. To monitor LLM latency, record end-to-end duration and, ideally, time-to-first-token for streaming. Watch p50, p95, and p99 rather than averages — tail latency is what users feel. Because latency varies by prompt length, model, and provider load, tie it back to the prompt version and model so you can tell a genuine regression from normal variance.
Quality. The hardest signal, because it is not in the API response. You approximate it with online evaluations — LLM-as-judge scores, regex or schema checks, and human review — plus implicit signals like user thumbs, retries, and edits. Logging quality scores alongside cost and latency is what lets you catch a regression that does not show up as an error.
Agent observability: tracing multi-step agents
A single LLM call is easy to reason about. An agent is not. Agent observability is the discipline of tracing an autonomous, multi-step run — planning steps, tool calls, retrieved context, and intermediate reasoning — as one connected session rather than a scatter of disconnected calls.
The core unit is the full-session trace: a tree that starts at the user's request and branches through every model call, every tool invocation, and every sub-agent, with inputs and outputs captured at each node. When an agent returns a wrong answer after fifteen steps, you need to see which step went off the rails — did the model pick the wrong tool, did a tool return bad data, did the plan itself drift? Without a connected trace you are guessing.
AI agent observability also has to handle drift. Agents are stateful and compounding: a small error early in a run cascades, and behavior shifts as prompts, tools, and models evolve. To monitor LLM drift in production, compare aggregate agent behavior over time — success rate, step count, tool-call distribution, cost per session — and alert when the distribution moves. A sudden jump in average step count often means the agent is looping; a change in tool-call mix often means a prompt or model change altered its reasoning.
PromptLayer provides multi-step agent and workflow tracing where every step is captured and each model call links back to the prompt version that drove it. Because the traces are tied to your prompt registry, you can tell whether an agent regressed because of a prompt edit or because of something upstream — the single most useful question when debugging agents. Wiring those traces into evaluations lets you score whole sessions, not just individual generations.
Leading LLM observability tools & platforms compared
The market splits along a few axes: open-source versus proprietary, tracing-first versus registry-first, and standalone versus part of a broader APM suite. Open-source options like Langfuse, Helicone, and Arize Phoenix appeal to teams that want to self-host for data control. Proprietary platforms like Datadog LLM Observability and LangSmith lead on enterprise integration and ecosystem depth. The dimension most teams underweight is the link between traces and prompt versions: an observability tool that logs a bad output but cannot tell you which prompt version produced it leaves you reconstructing that link by hand. The table below compares the leading LLM observability tools on the criteria that actually change day-to-day debugging. PromptLayer's differentiator is that observability is tied to the prompt registry — every log and trace is linked to the exact versioned prompt behind it — so a regression is one click from the change that caused it, and non-engineers can read the same traces engineers do.
| Platform | Focus | Prompt-version-linked traces | Cost/latency/token analytics | Open source | Best fit |
|---|---|---|---|---|---|
| PromptLayer | Prompt registry + observability, for technical and non-technical teams | Yes — traces tied to the prompt registry | Yes — per request and per prompt version | No (proprietary; self-host on Enterprise) | Teams that manage prompts as versioned assets and want logs tied to them |
| Langfuse | Open-source LLM engineering: tracing, prompts, evals | Yes | Yes | Yes (MIT, open-core) | Teams wanting an open-source, self-hostable all-in-one |
| Datadog LLM Observability | LLM tracing inside a broader APM suite | Partial — experiments, no dedicated registry | Yes | No (proprietary SaaS) | Orgs already standardized on Datadog |
| Arize Phoenix | Open-source tracing, evals, and troubleshooting | Yes — prompt playground with versioning | Yes | Source-available (Elastic License 2.0) | Teams focused on evaluation and experimentation |
| Helicone | AI gateway + observability via a proxy | Yes | Yes | Yes (Apache 2.0, open-core) | Teams wanting one-line proxy integration |
| LangSmith | Agent observability in the LangChain ecosystem | Yes — Prompt Hub versioning | Yes | No (proprietary; self-host on Enterprise) | Teams building on LangChain/LangGraph |
How to choose an LLM observability platform
There is no single best LLM observability platform for every team — the right choice depends on how you build. Use this checklist, mapped to features that meaningfully change how fast you debug, to evaluate any option.
- Per-prompt-version traces. Can you go from a bad output to the exact prompt version that produced it in one click? If traces are not linked to versioned prompts, you will spend regressions reconstructing state. This is PromptLayer's core design.
- Cost, latency, and token analytics. Look for per-request and per-version breakdowns, not just an account-wide total, so you can attribute a cost or latency change to a specific prompt or model.
- Agent and workflow tracing. If you run multi-step agents, full-session traces with tool calls and reasoning steps are non-negotiable — single-call logging will not cut it.
- Evaluations integration. Observability and evaluations belong together; you want to score production traces, not just view them, and catch regressions automatically.
- Search and filtering. You should be able to query request logs by metadata — user, model, version, score — to isolate a failure class in seconds.
- Alerting. Threshold and anomaly alerts on cost, latency, and quality so drift surfaces before users report it.
- API and SDK coverage. A REST API plus SDKs means you can instrument any stack; dashboards on top mean non-engineers can read the same data.
PromptLayer is built to check every box: full request logging, cost/latency/token analytics per prompt version, multi-step agent tracing, searchable logs, and a REST API plus SDK — all anchored to the prompt registry so technical and non-technical teammates work from the same source of truth.
Frequently asked questions
If you still have questions feel free to contact us at sales@promptlayer.com